Psychoacoustics explores how humans perceive and interpret sound, bridging the gap between physical sound properties and subjective auditory experiences. Key topics include:
- Pitch Perception: How frequency relates to pitch perception and its variability among individuals.
- Loudness: The influence of sound intensity and duration on loudness perception.
- Timbre: Characteristics that differentiate sounds with the same pitch and loudness, such as a violin versus a flute.
- Auditory Masking: How certain sounds obscure or alter the perception of others.
- Spatial Hearing: The ability to localize sound sources in three-dimensional space.
- Hearing Thresholds: The limits of human hearing, from the quietest to the loudest perceivable sounds.
Psychoacoustics is vital in fields like audio engineering, music production, and hearing aid design, informing how sound is optimized for human listeners.
Anatomy of the Ear
The human ear is a sophisticated organ responsible for detecting sound and maintaining balance. It consists of three main parts:
Outer Ear
- Components: The pinna (visible part) and the ear canal.
- Function: Collects sound waves and directs them to the eardrum, causing vibrations.

Image Source: Wikipedia - Outer Ear
Middle Ear
- Components: Three tiny bones called the ossicles (malleus, incus, and stapes).
- Function: Amplifies eardrum vibrations and transmits them to the oval window.
Image Source: Wikipedia - Middle Ear
Inner Ear
- Components: The cochlea (cochlea) and the vestibular system (vestibular system).
- Function: Converts mechanical vibrations into electrical signals via hair cells and maintains balance.
Image Source: Wikipedia - Inner Ear
Psychoacoustics: A Detailed Breakdown
Sensation
Auditory System
The auditory system processes sound through three main parts:
- Outer Ear: Collects sound waves. Learn more
- Middle Ear: Amplifies sound vibrations. Learn more
- Inner Ear: Converts vibrations into electrical signals. Learn more
Perception
Frequency
- Infrasound: Below 20 Hz. Learn more
- Audible Sound: 20 Hz to 20,000 Hz. Learn more
- Ultrasound: Above 20,000 Hz. Learn more
Instruments
- Piano: 32 Hz to 4186 Hz. Learn more
- Saxophone: Known for its rich tone. Learn more
Just Noticeable Differences (JND)
The smallest detectable frequency change. Learn more
Loudness
- Equal-Loudness Contours: Show how loudness perception varies. Learn more
The Fletcher-Munson curves, also known as equal-loudness contours, illustrate how human hearing sensitivity varies with frequency and loudness levels.
Image Source: Wikipedia - Equal-loudness contour
- Threshold of Hearing: Quietest perceivable sound. Learn more
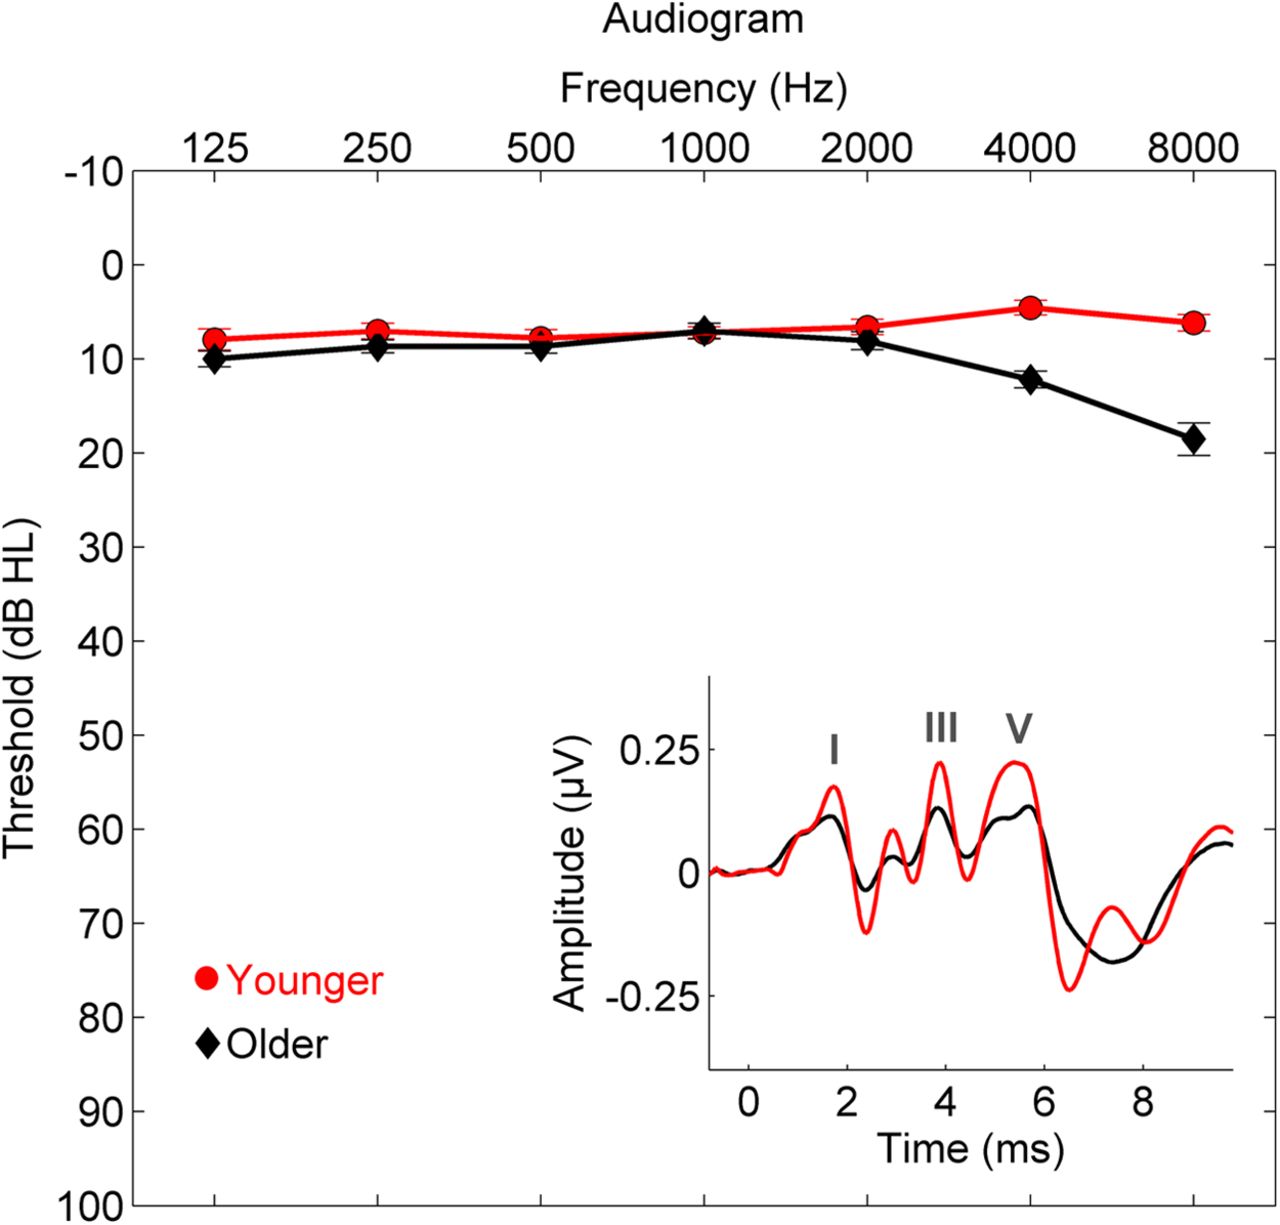
Image Source: Wikipedia - Hearing Thresholds
Hysteresis
Hysteresis refers to the phenomenon where the response of a system depends not only on its current state but also on its past states. In psychoacoustics, this can manifest in auditory perception, where the perception of a sound may be influenced by previously heard sounds or stimuli. This concept is crucial in understanding how the auditory system adapts and reacts over time to varying acoustic environments.
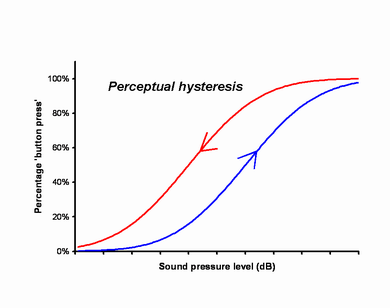
Image Source: Wikipedia - Hysteresis
- Threshold of Pain: Sounds above 120 dB. Learn more
Time
- Critical Bands: Frequency ranges where masking occurs. Learn more
- Temporal Masking: One sound obscures another. Learn more
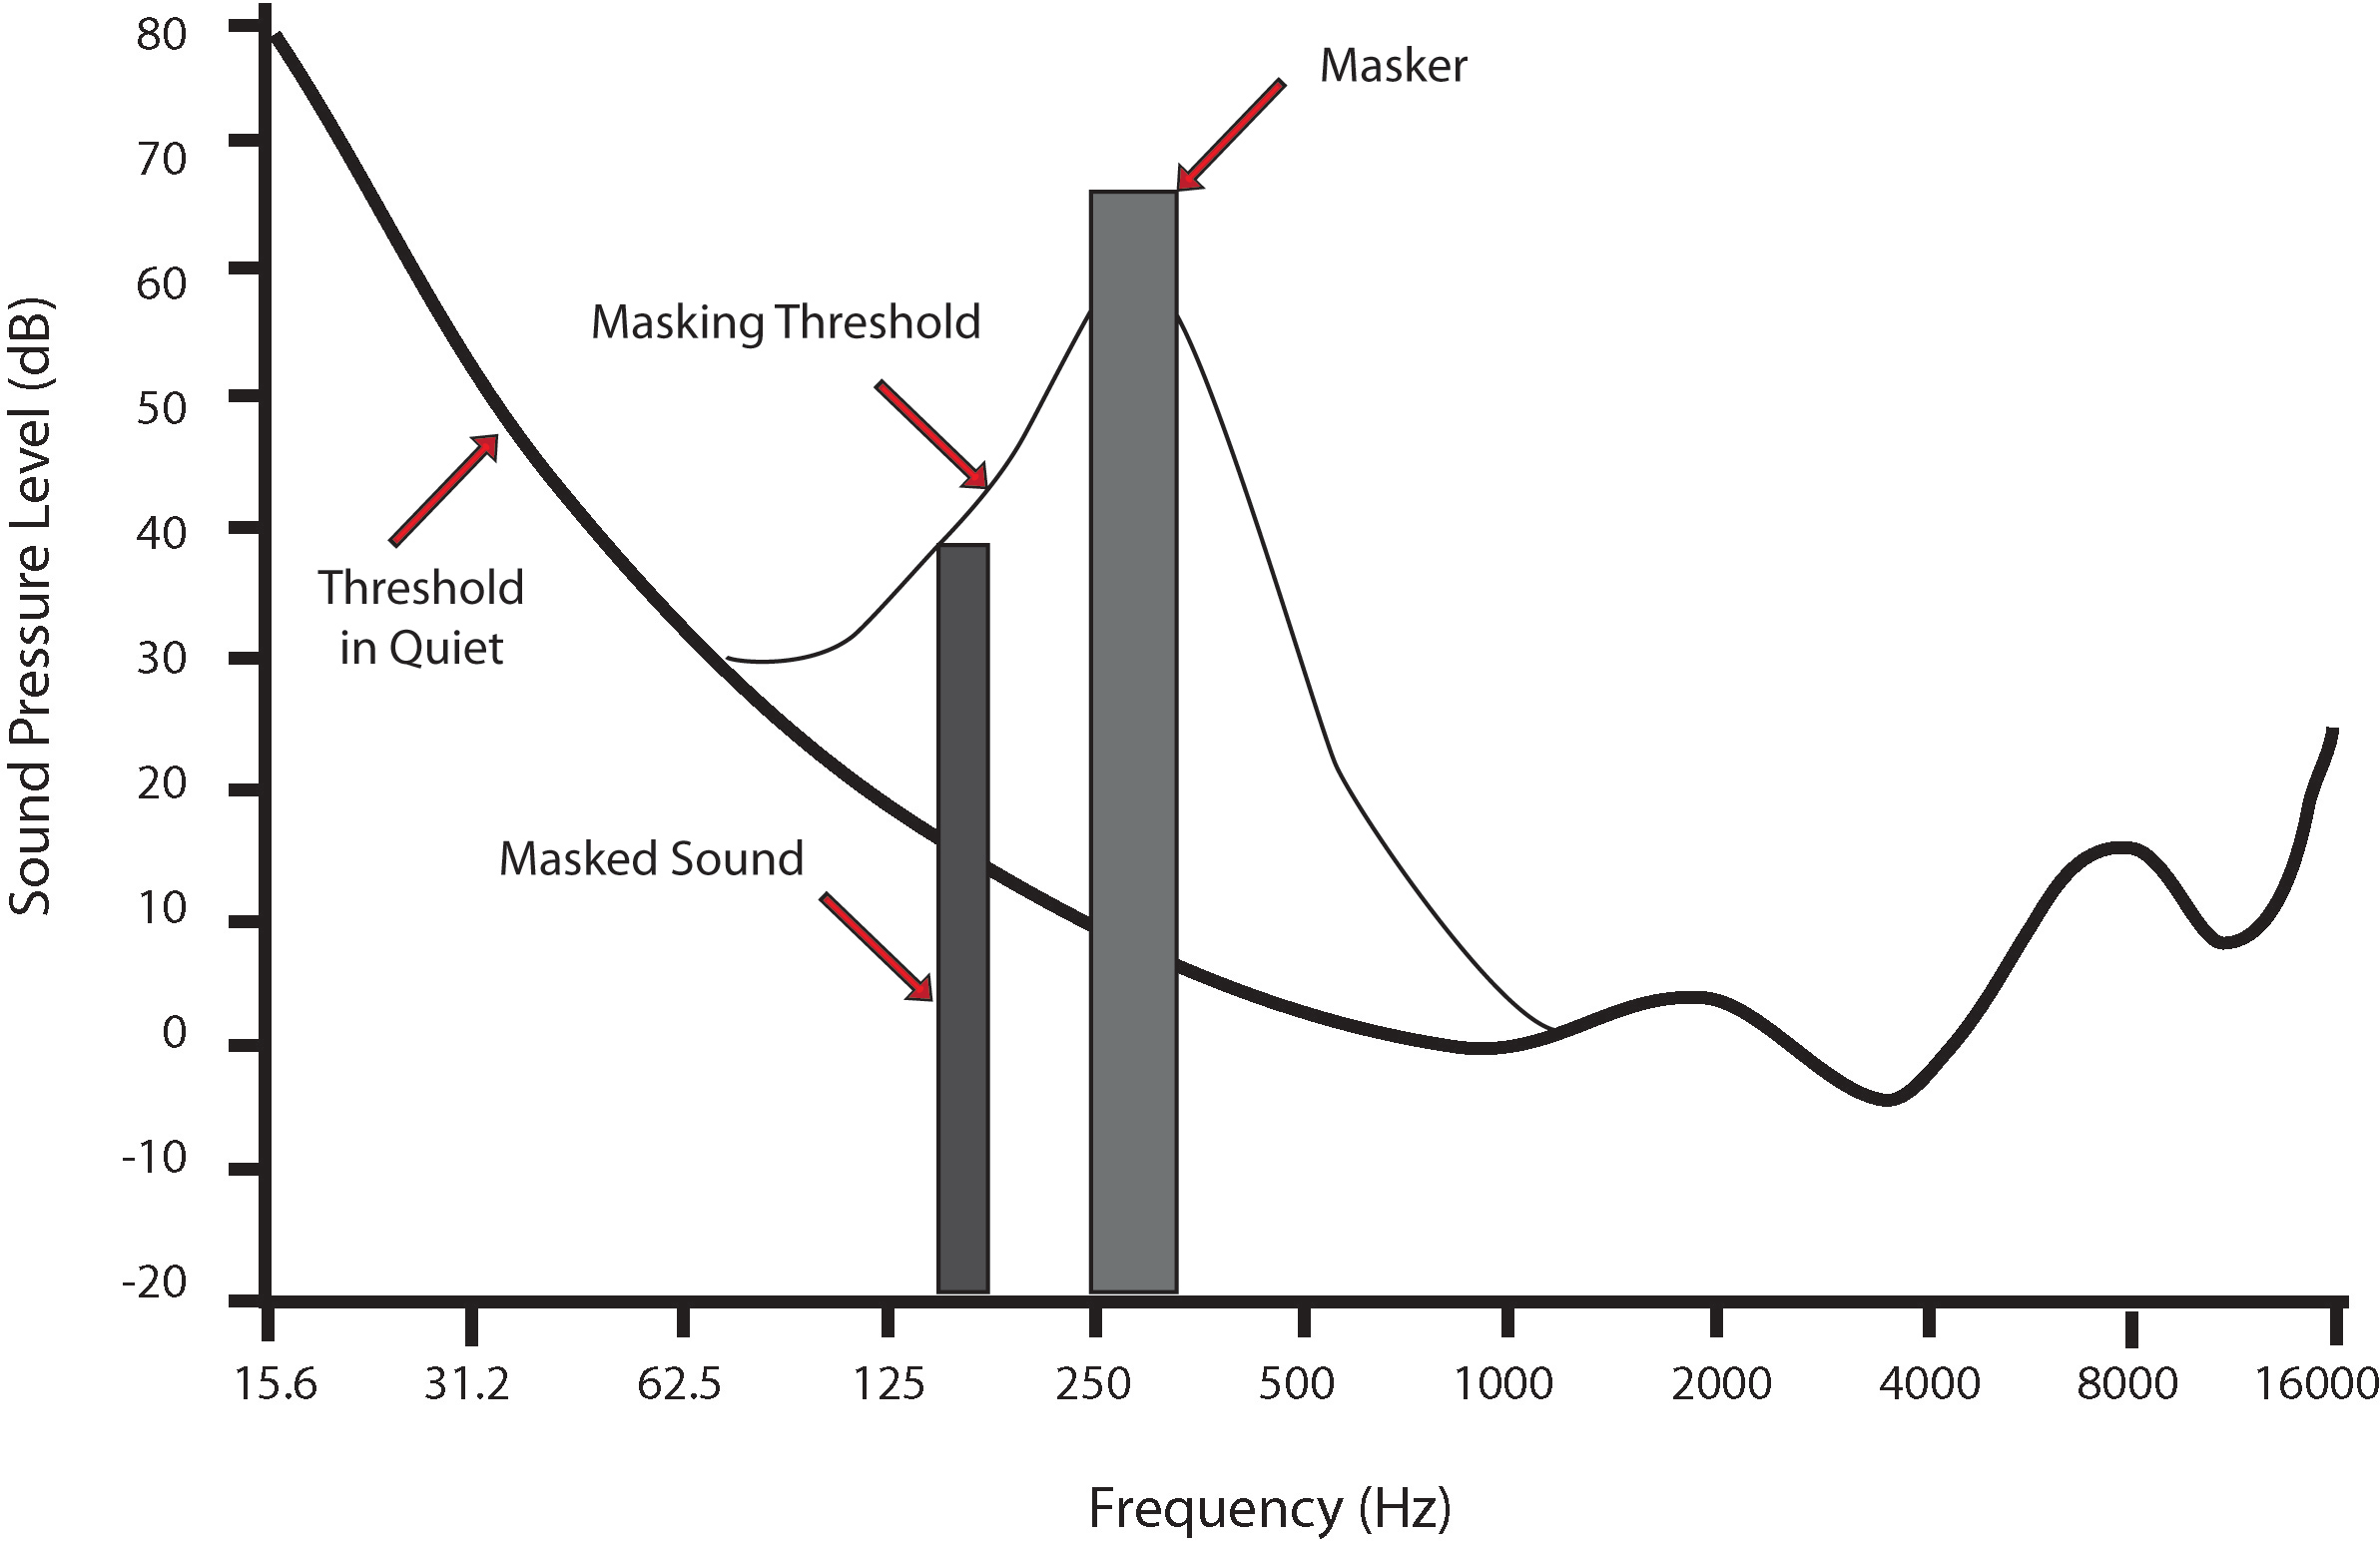
Image Source: Wikipedia - Audio Masking
Space
- Spatial Hearing: Localizing sound sources. Learn more
Cognition
The Brain
Processes auditory information via the cerebral cortex. Learn more
Auditory Cortex
Responsible for sound processing. Learn more
Digitization
Input/Output (I/O)
- Analog-to-Digital Converters (ADC): Convert analog signals to digital. Learn more
- Digital-to-Analog Converters (DAC): Convert digital signals to analog. Learn more
Digital Audio
Digital audio refers to the representation of sound in a digital format, enabling storage, manipulation, and playback using computers and digital devices. Key concepts include:
Sampling Rate: The number of samples taken per second to represent a sound wave. Common rates include:
- 44.1 kHz: Standard for CDs, providing a frequency range up to 22.05 kHz. Learn more
- 48 kHz: Widely used in video production and broadcasting.
- 96 kHz and 192 kHz: High-resolution audio formats for professional and audiophile applications.
Bit Depth: Determines the resolution or precision of each audio sample, affecting dynamic range and noise levels:
- 16-bit: Standard for CDs, offering a dynamic range of 96 dB.
- 24-bit: Common in professional audio, providing a dynamic range of 144 dB.
- 32-bit: Used in specialized applications for even greater precision. Learn more
Compression: Reduces file size by encoding audio data more efficiently:
- Lossy Compression: Formats like MP3 and AAC remove inaudible frequencies to save space, often at the cost of quality. Learn more
- Lossless Compression: Formats like FLAC and ALAC preserve all audio data, ensuring no quality loss.
Nyquist Theorem: States that the sampling rate must be at least twice the highest frequency in the audio signal to accurately reconstruct it. This principle underpins the choice of standard sampling rates. Learn more
Dynamic Range: The difference between the quietest and loudest parts of an audio signal. Higher bit depths allow for greater dynamic range, making them suitable for professional recording and mixing.
File Formats:
- WAV: Uncompressed audio format, widely used in professional settings.
- MP3: Popular lossy format for consumer audio.
- FLAC: Lossless format, ideal for audiophiles.
- AAC: Advanced lossy format, commonly used in streaming services.
Audio Interfaces: Devices that convert analog audio signals to digital (ADC) and digital signals back to analog (DAC). They are essential for recording and playback in digital audio workflows. Learn more
Latency: The delay between input and output in a digital audio system. Low-latency systems are critical for real-time applications like live performances and audio monitoring.
Digital audio has revolutionized the way sound is produced, distributed, and consumed, enabling innovations in music production, broadcasting, and multimedia applications.
Audio Visualizations
- Waveform: A visual representation of amplitude over time. Learn more
- Spectrogram: Displays frequency content over time. Learn more
- Log Mel Spectrogram: Mimics human hearing by applying the Short-Time Fourier Transform (STFT), Mel band-pass filters, and a logarithmic transformation to represent audio on a decibel scale. Widely used in audio-related tasks for its perceptual relevance. Learn more
- MFCCs (Mel-Frequency Cepstral Coefficients): Extracts and compresses audio features by applying the Discrete Cosine Transform (DCT) to the Log Mel spectrum. Commonly used in speech processing, music classification, and music information retrieval. Learn more
- CQT (Constant-Q Transform): Uses a logarithmic frequency scale with exponentially spaced center frequencies and varying filter bandwidths. Ideal for musical note frequency extraction and analysis. Learn more
Symbolic Representations
MIDI
MIDI (Musical Instrument Digital Interface) is a standard protocol for communicating musical performance data between electronic instruments and computers. It encodes information such as note pitch, velocity, duration, and control changes. Learn more
ABC Notation
ABC Notation is a text-based music notation system that uses ASCII characters to represent musical scores. It is widely used for folk and traditional music due to its simplicity and compatibility with text-based tools. Learn more
REMI
REMI (REvamped MIDI-derived events) is an enhanced representation of MIDI data designed to better capture musical rhythm and structure. It introduces features like Note Duration events, Bar and Position tokens, and Tempo events, making it suitable for music generation tasks. Learn more
MusicXML
MusicXML is an XML-based format for representing Western music notation. It encodes detailed musical elements such as notes, rests, articulations, and dynamics, making it ideal for sharing and analyzing sheet music. Learn more
Piano Roll
The Piano Roll is a visual representation of music, where time is displayed on the horizontal axis and pitch on the vertical axis. Notes are represented as rectangles, with their length indicating duration. It is commonly used in digital audio workstations (DAWs) for music editing and analysis. Learn more
Note Graph
A Note Graph is a graph-based representation of musical scores, where nodes represent notes and edges capture relationships such as sequence, onset, and sustain. This approach provides a structured way to analyze and model complex musical relationships. Learn more
- Ideas Roadshow: Believing Your Ears - Auditory Illusions
Diana Deutsch in conversation with Howard Burton (2015), Open Agenda Publishing.
Tools
- PaulXStretcher
- SonicVisualiser
Citations
Use the following syntax for citations: {cite}`holdgraf_evidence_2014`.